From a three-day reporting cycle to a dashboard refreshed every morning
Replacing a multi-day manual reporting cycle with an automated pipeline and a dashboard everyone trusts.

- Type
- Data & Dashboards
- Industry
- Manufacturing
- First phase
- 3 to 6 weeks
The situation
A fictional manufacturing group with four plants, each run as its own business unit, produces a monthly management pack. Each plant submits output, rejection, cost and sales figures in its own spreadsheet format, a finance analyst consolidates them, and the pack reaches the board around the middle of the following month. Plant heads regularly disagree about the numbers during the review.
Two problems compound each other. The process is slow, so decisions are made on stale information. And because each unit prepares its figures differently, the numbers are disputed, which undermines the whole exercise.
Fictional scenario, synthetic data. The company does not exist and no figures here describe a real deployment. The approach and features are real; the interfaces are illustrations.
Why this is difficult
- Consolidation takes several days of skilled finance time every month
- The pack reaches management well after the period it describes
- Each business unit calculates key measures differently
- Review meetings begin by reconciling figures rather than discussing them
- There is no way to drill from a summary number into transactions
- The entire process depends on one analyst's spreadsheet knowledge
- Mid-month questions cannot be answered without redoing the work
How we would build it
The technical work is a data pipeline and a semantic model. The more important work is a definitions workshop where the business units agree, in writing, what each measure includes. Without that step, an automated dashboard simply automates the disagreement.
- 01
Definitions first
Every measure is defined in writing and agreed across units before any pipeline is built. The definition is later visible in the dashboard itself.
- 02
Automated extraction
Data pulled directly from each unit's source systems on a schedule, removing the manual submission step entirely.
- 03
Common data model
A dimensional model with consistent hierarchies for entity, product, customer and time, so the units become comparable.
- 04
Reconciliation checks
Automated validation against trial balance and control totals, with alerts when a source does not tie out, so errors are found before the number is published.
- 05
Layered dashboards
A one-minute group summary, a unit-level view, and functional detail, each designed for how that audience reads.
- 06
Drill-down to transactions
Any figure can be opened down to the underlying records, which changes the review from an argument into an investigation.
- 07
Scheduled distribution
PDF and Excel packs generated and delivered automatically for people who prefer a document to a dashboard.
Recognise this problem?
Tell us how it works in your business. You get a written plan and a fixed price for the first phase.
What it looks like
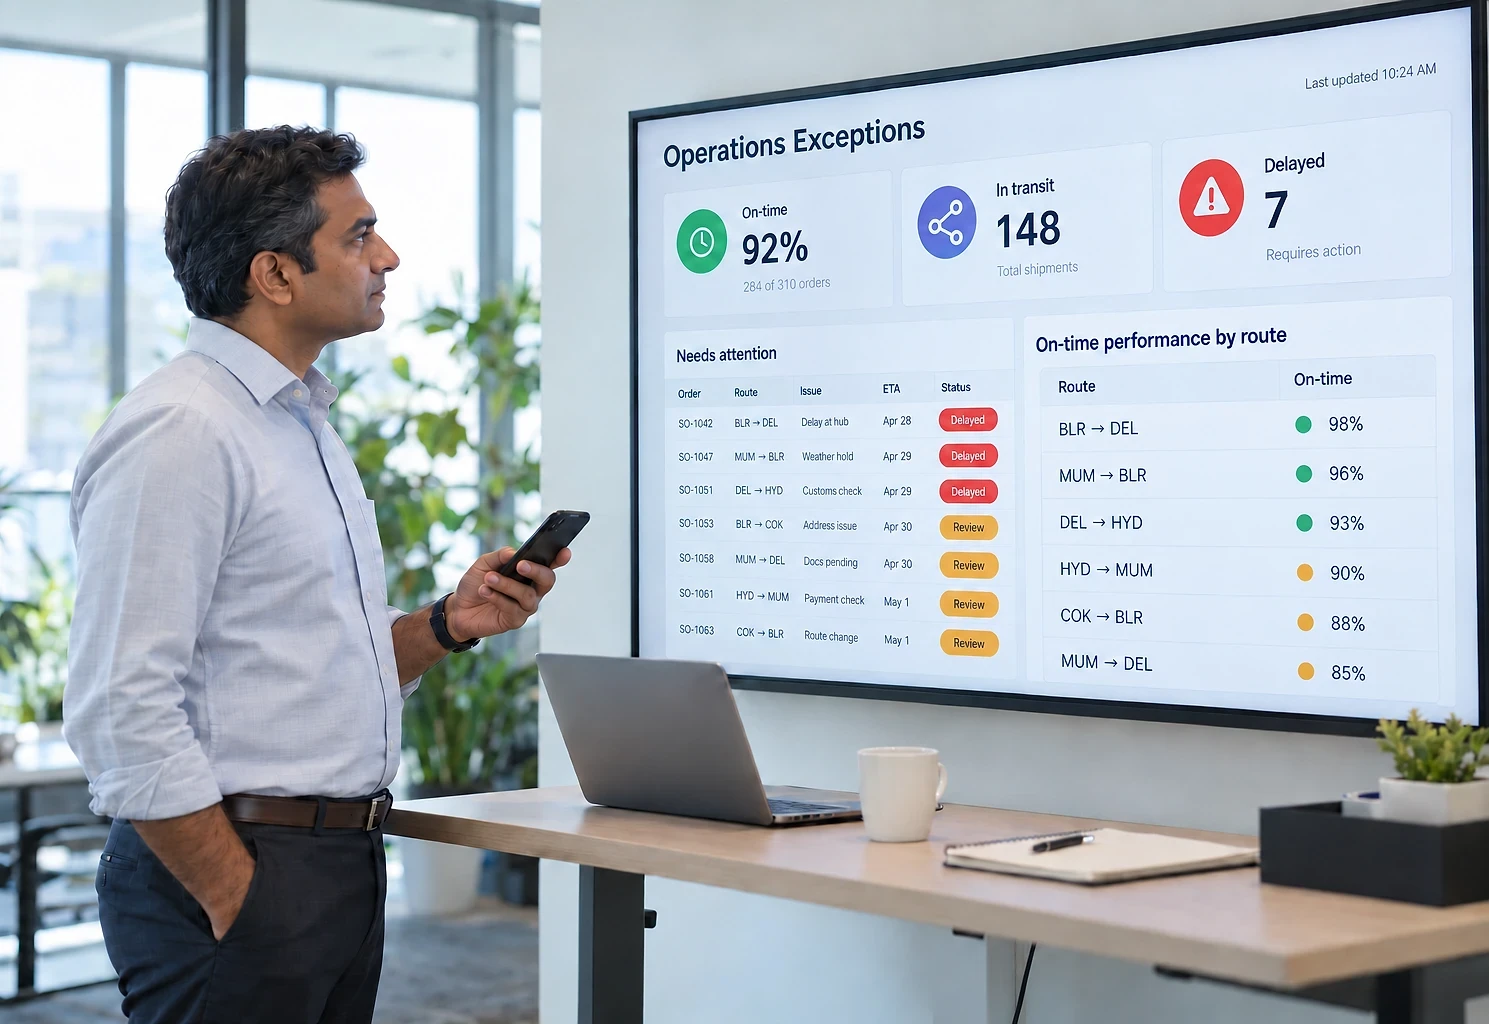
Drawn rather than screenshotted, so nothing here can be mistaken for a real client system. Every figure on the screen is sample data, not a result.
What it would be built with
The final choice depends on what the business already runs.
- Business intelligence
- Power BI or Tableau (whichever you already use)Custom web dashboards
- Data platform
- SQL ServerAzure SQLStar schema modellingIncremental loading
- Pipelines
- SQLPythonScheduled ETLReconciliation checks
- Modelling & delivery
- DAXRow-level securityScheduled PDF and Excel export
How a single item moves through the system
- 1
Definitions agreed
Business units agree what each measure includes and excludes, recorded in a definitions document.
- 2
Sources connected
Extraction is configured against each unit's systems, replacing manual spreadsheet submission.
- 3
Data loaded and validated
Scheduled loads run with reconciliation checks; failures alert the data owner rather than silently producing wrong figures.
- 4
Model refreshed
The model updates overnight, so each morning the dashboards show the position as of the previous day.
- 5
Reviewed continuously
Management can look at current figures at any point in the month rather than waiting for the pack.
- 6
Distributed
Scheduled packs go out automatically to those who prefer a document, with the same numbers underneath.
What this kind of system tends to change
Described qualitatively and deliberately so. We have not deployed this scenario, so quoting a percentage improvement would be inventing evidence.
- 1
Days of skilled time recovered
The consolidation exercise disappears, and finance moves from assembling numbers to interpreting them.
- 2
Current information
Management sees the position during the month rather than after it, which is the difference between correcting and recording.
- 3
Meetings that discuss rather than reconcile
Agreed definitions and a single source remove the reconciliation argument that opens most review meetings.
- 4
Questions answered in the meeting
Drill-down means a query about an unexpected figure is resolved immediately rather than carried to the next month.
- 5
A process that survives people
An automated, documented pipeline does not depend on one analyst's undocumented spreadsheet.
Services and solutions behind this
Data Analytics & Dashboards
Turning scattered operational data into reports and dashboards people use to make decisions.
API & System Integrations
Connecting the systems you already run so data moves between them without a person in the middle.
Management Reporting Dashboard
One current view of the business, refreshed automatically, with numbers every department agrees on.

Is this close to your situation?
If this scenario resembles what happens in your business, we can have a much more specific conversation. Tell us how it works today and we will tell you what we would change first.
The first conversation is free, with no obligation.