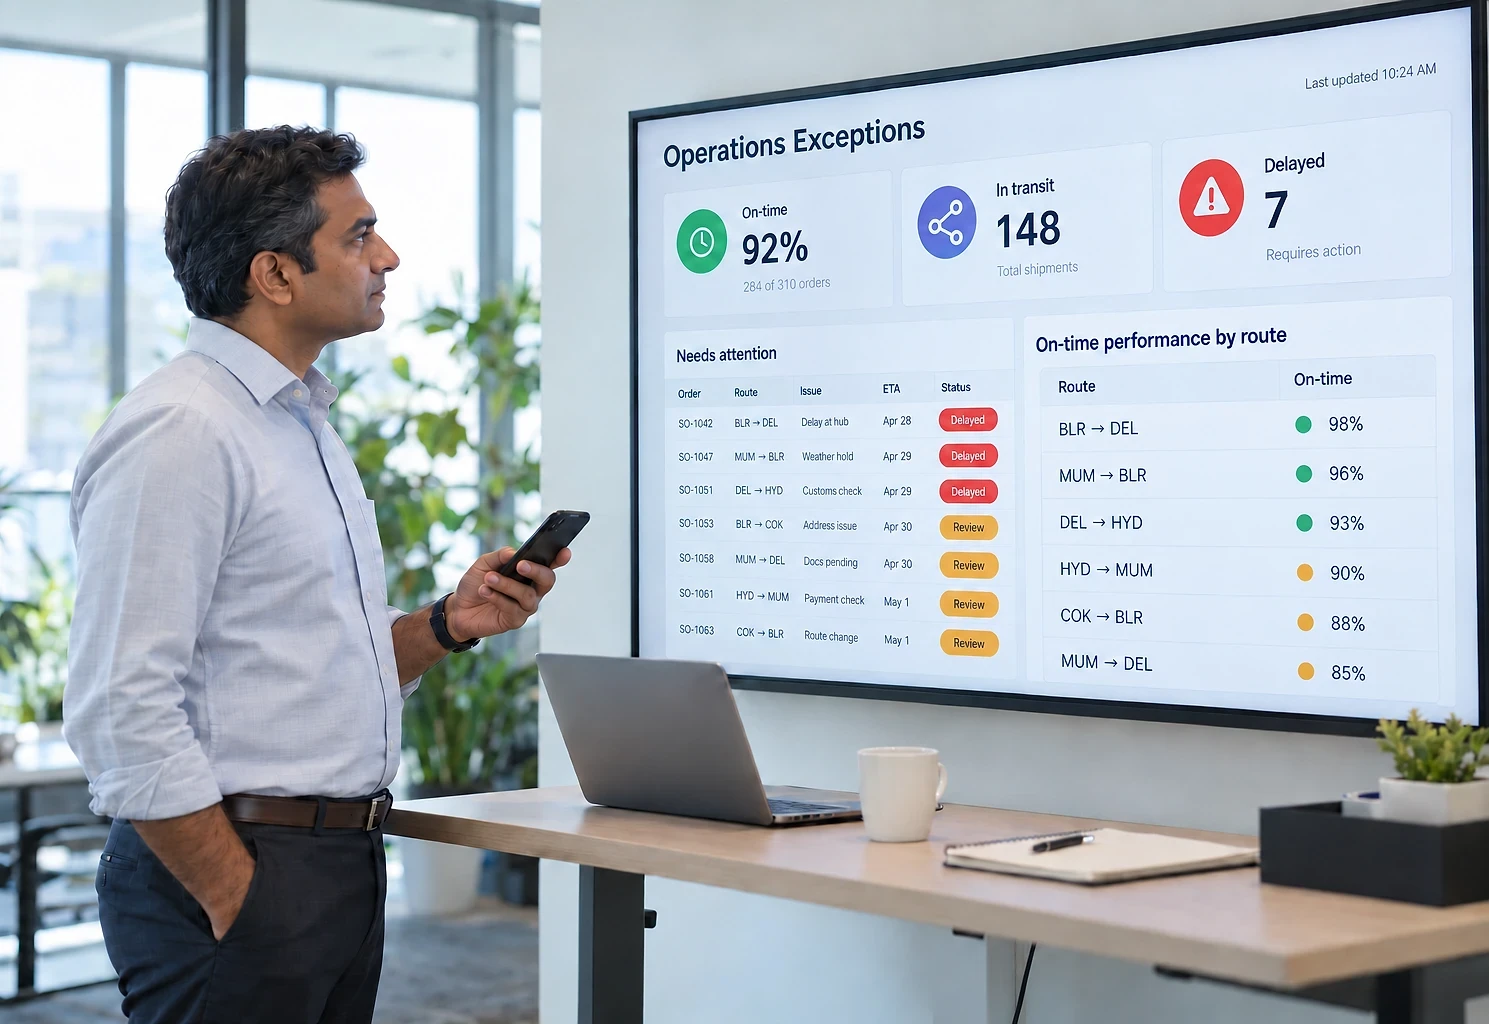
One screen showing what is moving and what is stuck
A transport company's single view of what is late, what is stuck and how each lane is performing, built around exceptions rather than totals.
- Type
- Data & Dashboards
- Industry
- Logistics & Transportation
- First phase
- 4 to 8 weeks
The situation
A fictional regional transport company runs about 60 vehicles across several lanes. Consignment status is coordinated through WhatsApp groups, trip data is entered into a spreadsheet at the end of each day, and management sees a performance summary roughly two weeks after the month ends.
The operational information exists, but it is scattered across conversations, sheets and people's heads. By the time it is consolidated into something readable, the window to act on it has closed.
Fictional scenario, synthetic data. The company does not exist and no figures here describe a real deployment. The approach and features are real; the interfaces are illustrations.
Why this is difficult
- Consignment status is spread across WhatsApp groups and phone calls
- Nobody can say how many consignments are currently delayed without asking around
- Vehicle utilisation is calculated manually at month end
- Delivery performance by lane and customer is not measured at all
- Detention and demurrage are discovered during billing disputes
- Management reporting arrives around two weeks after the period it covers
- Recurring problems on specific lanes go unnoticed because nothing is aggregated
How we would build it
The dashboard is not the hard part. The work is getting status captured once, at the point it happens, in a structured form. Once that exists, the operational and management views follow easily.
- 01
Structured status capture
A simple mobile screen for drivers and branch staff to record each checkpoint, replacing free-text WhatsApp messages with structured, timestamped events.
- 02
Consolidated data pipeline
Trip data, consignment events, vehicle records and customer contracts brought into one model on a scheduled refresh.
- 03
Live operations view
What is in transit, what has missed its expected checkpoint and what needs intervention today, refreshed continuously.
- 04
Exception-first design
The screen leads with what is going wrong rather than with totals, because the operations team needs to act rather than to admire.
- 05
Management view
On-time delivery by lane and customer, vehicle utilisation, cost per trip and revenue by route, with period comparison.
- 06
Automated alerts
Notification when a consignment misses an expected checkpoint or a vehicle has been idle beyond a threshold.
- 07
Drill-down
From any summary figure into the individual consignments behind it, so a question can be answered rather than deferred.
Recognise this problem?
Tell us how it works in your business. You get a written plan and a fixed price for the first phase.
What it looks like
Drawn rather than screenshotted, so nothing here can be mistaken for a real client system. Every figure on the screen is sample data, not a result.
What it would be built with
The final choice depends on what the business already runs.
- Dashboards
- Power BICustom web dashboardsMobile layoutsRow-level security
- Data
- SQL ServerPostgreSQLDimensional modellingScheduled ETL
- Capture
- Progressive web appPhotograph and signature captureOffline-tolerant entry
- Alerts
- Scheduled jobsWhatsApp Business APIEmail distribution
How a single item moves through the system
- 1
Checkpoint recorded
Branch staff or driver records loading, departure, arrival or delivery on a phone, with supporting photograph and location.
- 2
Event stored
The event is written against the consignment with a timestamp, creating an auditable movement history.
- 3
Delay detection
Expected checkpoint times are compared against actuals, and anything running late is flagged automatically.
- 4
Operations acts
The exception list drives the day: the team works through flagged consignments rather than through a status call.
- 5
Data aggregated
The pipeline consolidates events, trips and contracts into the reporting model on schedule.
- 6
Management reviews
Performance by lane, customer and vehicle is available continuously rather than after month end.
What this kind of system tends to change
Described qualitatively and deliberately so. We have not deployed this scenario, so quoting a percentage improvement would be inventing evidence.
- 1
Problems visible while they can be fixed
A delay surfaced the same day can be acted on. The same delay seen in a monthly report is only history.
- 2
Fewer status calls
When status is captured once and visible to everyone, the coordination calls that fill the day largely disappear.
- 3
Billing supported by evidence
Timestamped checkpoints make detention and demurrage claims defensible rather than negotiable.
- 4
Lane-level insight
Aggregated performance reveals which lanes and customers are consistently problematic, which is invisible when data lives in conversations.
- 5
Reporting effort recovered
The manual month-end consolidation stops being a task at all.
Services and solutions behind this
Data Analytics & Dashboards
Turning scattered operational data into reports and dashboards people use to make decisions.
Custom Web Applications
Internal tools and business systems built around your actual process instead of forcing you into someone else's.
Management Reporting Dashboard
One current view of the business, refreshed automatically, with numbers every department agrees on.
Inventory & Dispatch Tracker
Live stock positions across every store and warehouse, with alerts before you run out and a record of what left.

Is this close to your situation?
If this scenario resembles what happens in your business, we can have a much more specific conversation. Tell us how it works today and we will tell you what we would change first.
The first conversation is free, with no obligation.