Data analytics dashboards that answer the question, not just display data
Most businesses have the data. What they lack is a trustworthy, current view of it that everyone agrees on. We build the pipelines and dashboards that get you there.
- Typical timeline
- 6 to 10 weeks
- Usually built with
- Power BI or Tableau, SQL, Python
- You own
- Code, data and accounts, in your name
About data analytics & dashboards
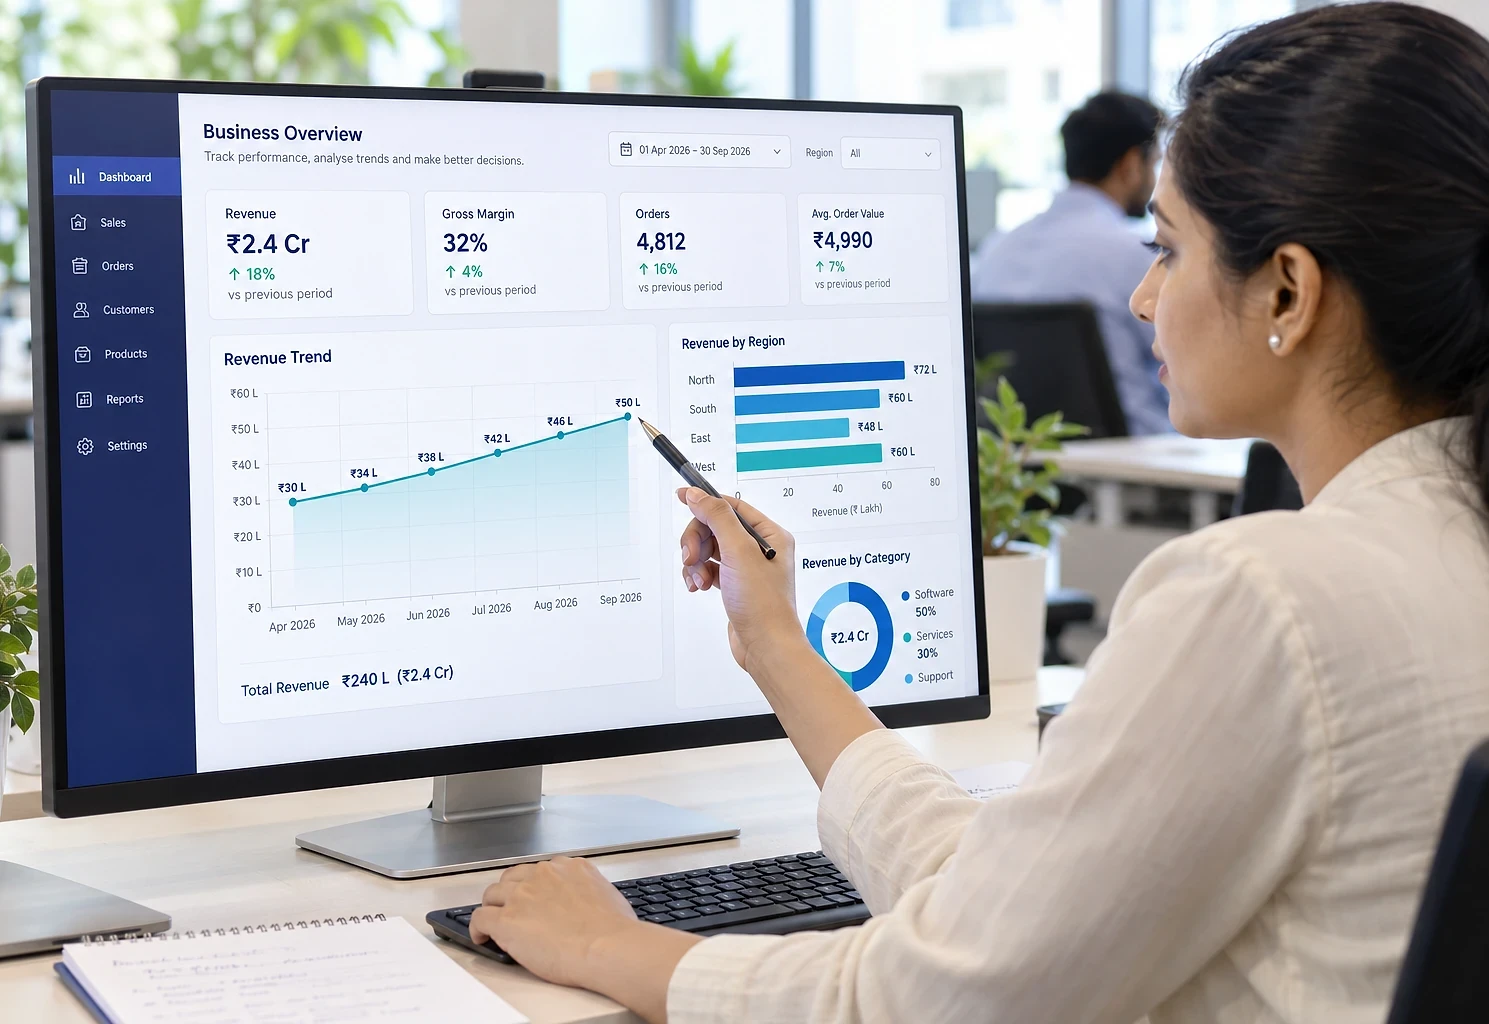
A dashboard is only useful if people trust the numbers and the numbers arrive in time to act on. That means the work is mostly upstream: getting data out of the systems it lives in, agreeing what each measure means, and making the refresh reliable. The visual layer is the last ten percent. We do the full job, from source to screen, with the definitions written down so two departments stop arguing about whose figure is right.
When reporting has become a monthly scramble
Usually a good fit for
- Management teams making decisions from reports that are days or weeks old
- Businesses where each department reports a different number for the same measure
- Finance and operations teams spending days each month assembling reports
- Companies with data spread across an ERP, a CRM, spreadsheets and a website
- Owners who want a single view of the business without asking three people for it
Signs it is time
- Monthly reporting takes days of copying and reconciling between files
- Two departments present different figures for the same metric in the same meeting
- By the time a report is ready, the period it covers is already over
- The report only works because one person knows which columns to fix
- Data lives in systems that do not talk to each other
Dashboards and pipelines we build
Management dashboards
A single view of the measures that matter to the business, refreshed automatically, with the ability to drill from a headline number to the records behind it.
Operational dashboards
Near-real-time views for the people running daily operations: what is pending, what is late, what needs attention now.
Data pipelines and warehouses
Automated extraction from your source systems into a clean, consistent structure that reporting can rely on.
Automated report distribution
Scheduled reports delivered by email or WhatsApp in PDF or Excel, so people who do not open dashboards still get the numbers.
Self-service reporting
A governed model that lets business users build their own views without needing a developer or breaking the definitions.
Data quality and reconciliation
Checks that surface gaps, duplicates and mismatches between systems before they reach a report.
What's included in every dashboard project
- Automated refresh on a schedule you choose, with failure alerts
- A written definition for every measure, visible in the dashboard itself
- Drill-down from summary to transaction level
- Row-level security so each viewer sees only their region, branch or team
- Period comparison: this month against last month, this year against last year
- Trend and exception highlighting rather than walls of numbers
- Mobile layouts for management who check figures away from a desk
- Export to Excel and PDF for people who need to work with the underlying data
- Historical snapshots so you can see what a figure was when a decision was made
- Data quality checks that flag missing or suspicious values
- 30-day bug-fix warranty after launch
Not included: third-party fees such as Power BI or Tableau licences, cloud database or Microsoft Fabric capacity, and hosting. These are billed to you directly at cost and estimated in the quote.
Tools we typically use
Final choice made during scoping.
- Dashboards
- Power BI or Tableau (whichever you use)Custom web dashboards (Next.js)
- Data platform
- SQL ServerPostgreSQLMicrosoft Fabric
- Pipelines & modelling
- PythonSQLDAX
How a dashboard project runs
Typical timeline: 6 to 10 weeks, depending on scope and how quickly access and content arrive.
- 013-5 days
Agree the questions
We start from the decisions you need to make, not the charts you would like. Each dashboard element must answer a question someone asks.
- 023-5 days
Audit the sources
Where the data lives, how clean it is, how it can be extracted and how often it changes. This is where realistic timelines are set.
- 032-4 days
Define the measures
Written definitions for every metric, agreed across departments. This step prevents the most common cause of dashboards being abandoned.
- 042-4 weeks
Build the pipeline and model
Extraction, cleaning and a data model built for the questions being asked, with the refresh automated and monitored.
- 051-2 weeks
Build and review the dashboards
Designed for how each audience reads: management gets summary and trend, operations gets detail and exceptions.
- 061 week
Validate and hand over
Figures reconciled against a known source until they match, then training for each user group and documentation of the model.
Tired of reports that never match?
Tell us about it. You get a written scope and a fixed price, with no obligation.
How our fixed quotes and payments work →What trustworthy reporting changes
What tends to happen, not a guarantee.
- 1
Days of manual reporting recovered
Once the pipeline runs itself, the monthly reporting scramble becomes a review rather than an assembly job.
- 2
One agreed number
Written definitions end the recurring meeting argument about whose figure is correct.
- 3
Problems visible while they can still be fixed
Current data means a bad trend is spotted in week two rather than at the month-end review.
- 4
Decisions with evidence behind them
Being able to drill from a headline into the underlying records turns a discussion into an investigation.
- 5
Reporting that survives staff changes
An automated, documented pipeline does not depend on one person's spreadsheet knowledge.
Do we need Power BI, or can it be a web dashboard?
Power BI is strong when your team wants to explore data themselves and you are already in the Microsoft ecosystem. A custom web dashboard is better when the reporting needs to sit inside an application your users already log into, when you want to avoid per-user licence costs, or when the visuals need to be specific to your business. We recommend based on your situation rather than a preference.
Our data is messy. Is that a problem?
It is normal, and it is part of the work. The audit stage surfaces duplicates, inconsistent naming, missing values and mismatches between systems. Some of these we clean in the pipeline; others need a fix at the source, and we will tell you which are which. Building a dashboard on unexamined data is how dashboards lose credibility.
How current will the numbers be?
That is a decision, not a technical limit. Daily refresh is common and inexpensive. Hourly or near-real-time is achievable where the source systems allow it, at a somewhat higher cost. We match the refresh frequency to how quickly you can act on the information.
Can we still get reports in Excel?
Yes, and we usually recommend it. Plenty of finance and operations work genuinely happens in Excel. Every dashboard supports export, and scheduled Excel or PDF reports can be delivered by email so people who prefer that keep getting it.
Can different people see different data?
Yes. Row-level security means a branch manager sees their branch, a regional head sees their region and the director sees everything, from the same dashboard with the same definitions.
Is a dashboard project cheaper than a full application?
Generally, yes, which is why it is often a good first project. Cost depends mainly on how many source systems are involved, the state of the data and how much modelling is needed. After a free scoping call you get a fixed, written quote, and most clients start with one dashboard or one phase before adding more.
Ready-made reporting systems you can start from
Management Reporting Dashboard
One current view of the business, refreshed automatically, with numbers every department agrees on.
Inventory & Dispatch Tracker
Live stock positions across every store and warehouse, with alerts before you run out and a record of what left.
Order Management System
One system tracking every order from enquiry to delivery, whichever channel it arrived through.

Talk to us about data analytics & dashboards
Tell us what the work looks like today and what is not working. We will come back with what we think it involves, a realistic timeline and a fixed price.
The first conversation is free, with no obligation.